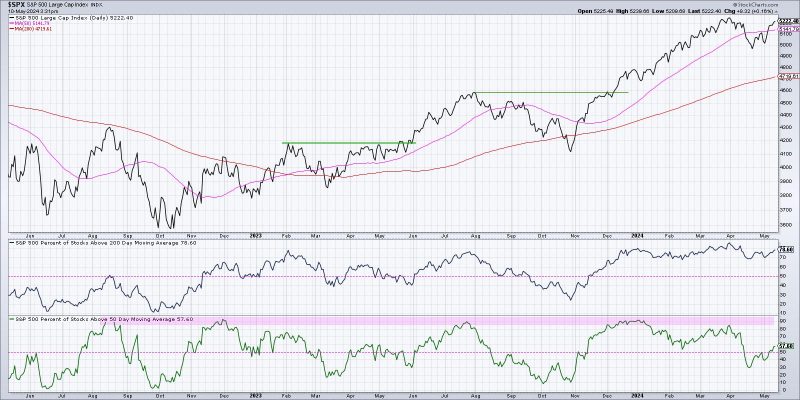
In the world of finance and investing, successfully predicting market trends is key to profitable trading. Bullish market trends indicate a positive sentiment among investors, with rising asset prices and strong market performance. While identifying a bullish market trend can be challenging, there are several breadth indicators that can help confirm the direction of the market. In this article, we will explore three breadth indicators that are commonly used to confirm a bullish market trend.
1. Advance-Decline Line (A/D Line):
The Advance-Decline Line is a breadth indicator that measures the number of advancing stocks versus declining stocks in a particular market index. This indicator provides valuable information about the overall market sentiment and can help confirm the strength of a bullish trend. A rising A/D Line indicates that more stocks are advancing than declining, suggesting broad market participation and underlying strength in the market.
Investors often look for divergence between the A/D Line and the underlying market index. If the A/D Line is rising while the market index is consolidating or pulling back, it can signal a bullish trend reversal or continuation. Conversely, a declining A/D Line alongside a rising market index may indicate a weakening market trend, potentially leading to a market correction or reversal.
2. New Highs-New Lows Ratio:
The New Highs-New Lows Ratio is another breadth indicator that measures the number of stocks hitting new highs versus new lows within a specific time frame. This ratio provides insights into market breadth and helps investors gauge the overall health of the market trend. In a bullish market trend, there should be a higher number of stocks reaching new highs compared to those making new lows, indicating strength and momentum in the market.
Investors often look for divergences in the New Highs-New Lows Ratio to confirm a bullish trend. If the ratio is expanding during a market rally, it suggests that more stocks are participating in the uptrend, supporting the bullish case. Conversely, a narrowing ratio or a decline in new highs amid a rising market may signal weakening market breadth and potential profit-taking behavior among investors.
3. Bullish Percent Index (BPI):
The Bullish Percent Index is a breadth indicator that measures the percentage of stocks within a specific market index that are trading on a bullish technical signal, such as above their moving averages or breaking out to new highs. The BPI helps investors assess the overall bullish sentiment among market participants and can provide confirmation of a bullish market trend.
A rising BPI indicates that a higher percentage of stocks within the index are displaying bullish characteristics, suggesting broad-based strength in the market. Conversely, a declining BPI may signal deteriorating market breadth and potential weakness in the market trend. Investors often use the BPI in conjunction with other technical indicators to confirm a bullish market outlook and make informed trading decisions.
In conclusion, breadth indicators play a crucial role in confirming a bullish market trend and providing valuable insights into market breadth, sentiment, and strength. By analyzing indicators such as the Advance-Decline Line, New Highs-New Lows Ratio, and Bullish Percent Index, investors can gain a better understanding of market dynamics and make informed trading decisions. Remember that no single indicator can predict market movements with certainty, so it is essential to use a combination of indicators and technical analysis tools for a comprehensive assessment of market trends.
