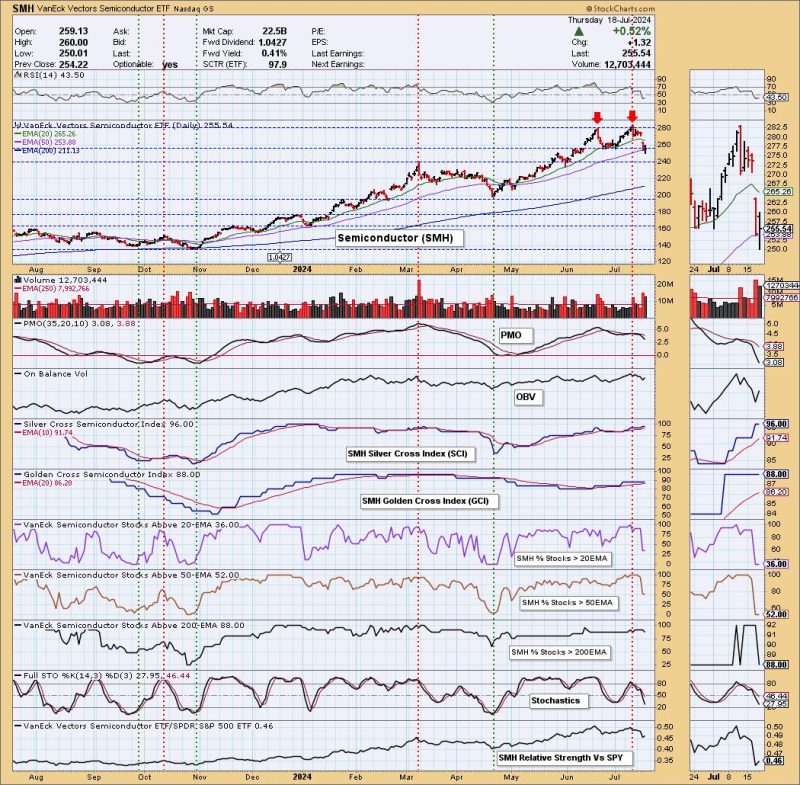
In a recent analysis of the semiconductor industry, a concerning pattern has emerged known as the double top pattern on the SMH ETF. This technical signal is indicative of a potential trend reversal in the price action of semiconductor stocks, signaling a possible downturn in the near future. Understanding the implications of this pattern is crucial for investors and traders in the semiconductor sector.
What is the Double Top Pattern?
The double top pattern is a bearish technical analysis pattern that occurs after an extended uptrend in a stock or index. It is characterized by two consecutive peaks at similar price levels, separated by a trough or a pullback. The pattern is considered complete when the price falls below the support level located at the trough between the two peaks, confirming a trend reversal.
In the case of the SMH ETF, which tracks the performance of semiconductor stocks, the formation of a double top pattern suggests that the sector may be losing momentum after a period of strong growth. Investors and traders often use technical analysis patterns like the double top to anticipate potential reversals in price trends and adjust their investment strategies accordingly.
Implications for Semiconductor Stocks
The emergence of a double top pattern on the SMH ETF indicates that semiconductor stocks may be at risk of a downward correction in the coming weeks or months. As one of the key drivers of the technology sector and the broader market, any weakness in semiconductor stocks could have ripple effects across the entire stock market.
Investors with exposure to semiconductor stocks or ETFs like SMH should closely monitor price developments and key support levels to gauge the strength of the double top pattern. If the price breaks below the support level following the formation of the second peak, it could signal a confirmation of the pattern and a potential trend reversal.
Risk Management Strategies
For investors and traders in the semiconductor sector, risk management is crucial when dealing with potential trend reversals signaled by technical patterns like the double top. Setting stop-loss orders at key support levels or using options strategies to hedge against downside risk are common risk management techniques to protect against sudden price movements.
Additionally, diversifying investment portfolios across different sectors and asset classes can help mitigate the impact of a downturn in semiconductor stocks. By spreading risk and avoiding overexposure to a single sector, investors can better weather market volatility and protect their capital during uncertain times.
Conclusion
In conclusion, the double top pattern on the SMH ETF raises concerns about a potential trend reversal in semiconductor stocks. Investors and traders should pay close attention to price developments and support levels to assess the strength of the pattern and adjust their investment strategies accordingly. By implementing effective risk management strategies and maintaining a diversified portfolio, investors can navigate market uncertainties and protect their investments in the semiconductor sector.
