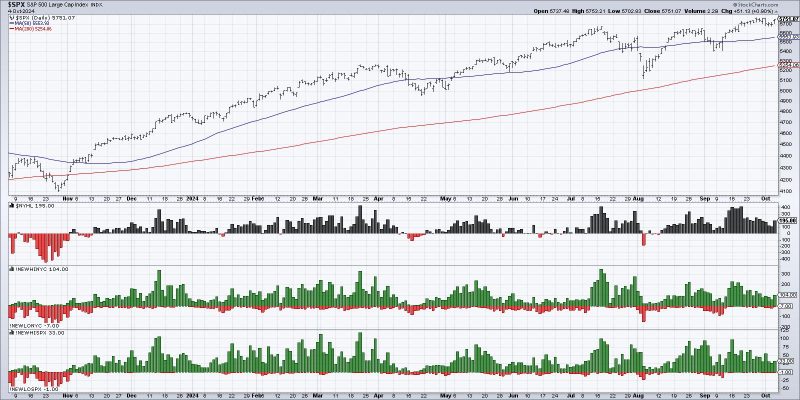
In examining market breadth indicators, investors often focus on metrics such as the number of advancing versus declining stocks, the volume of shares traded, and the overall momentum of the market. Understanding market breadth is essential for assessing the health of the stock market and identifying potential shifts in investor sentiment. However, the interpretation of market breadth data can be complex and may vary depending on the specific indicators being analyzed.
One commonly used measure of market breadth is the Advance-Decline Line (ADL), which tracks the number of advancing stocks versus declining stocks on a daily basis. A rising ADL suggests that the majority of stocks are experiencing positive momentum, indicating broad market strength. Conversely, a declining ADL may signal widespread weakness in the market. By monitoring the ADL, investors can gauge the overall participation of stocks in a market rally or decline.
Another important market breadth indicator is the McClellan Oscillator, which is based on the difference between advancing and declining issues over a short-term period. The McClellan Oscillator provides a more sensitive measure of market breadth compared to the ADL and is useful for identifying short-term overbought or oversold conditions in the market. A high McClellan Oscillator reading indicates that the market may be due for a pullback, while a low reading suggests potential buying opportunities.
In addition to these indicators, investors may also consider analyzing market breadth through the use of sector breadth measures. By examining how individual sectors are performing relative to the overall market, investors can identify areas of strength and weakness in the economy. For example, if defensive sectors such as utilities and consumer staples are outperforming cyclical sectors like technology and industrials, it may indicate a more risk-averse market environment.
It is important to note that market breadth indicators should be used in conjunction with other tools and analysis methods to make informed investment decisions. While market breadth can provide valuable insights into market trends and investor sentiment, it is not a foolproof predictor of future stock market performance. As with any financial indicator, market breadth data should be interpreted within the broader context of economic conditions, company fundamentals, and geopolitical factors.
In conclusion, market breadth indicators play a crucial role in evaluating the overall health and direction of the stock market. By tracking the breadth of market participation and analyzing sector trends, investors can gain valuable insights into market sentiment and potential shifts in market direction. While market breadth indicators offer valuable information, they should be used in conjunction with other tools and analysis methods to make well-rounded investment decisions.
