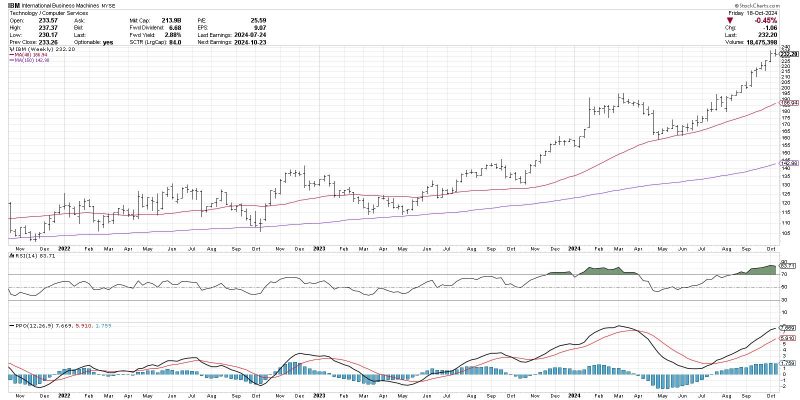
The Moving Average Convergence Divergence (MACD) indicator is a popular tool in technical analysis that many traders use to identify potential changes in trends in the financial markets. One aspect of the MACD indicator that is gaining attention is the MACD Histogram, which is derived from the MACD line and the signal line. The MACD Histogram is essentially a visual representation of the difference between the MACD line and the signal line. By analyzing the direction and size of the bars in the MACD Histogram, traders can potentially anticipate trend changes and identify trading opportunities.
Interpreting the MACD Histogram requires an understanding of how it is calculated and what the different patterns in the histogram represent. When the MACD line crosses above the signal line, the MACD Histogram generates positive values, indicating that the short-term momentum is turning bullish. On the other hand, when the MACD line crosses below the signal line, the MACD Histogram produces negative values, suggesting a shift towards bearish momentum. The size of the bars in the histogram can also provide insights into the strength of the trend, with larger bars suggesting stronger momentum.
One of the key advantages of using the MACD Histogram is its ability to provide early signals of potential trend changes. Unlike traditional trend-following indicators that lag behind price movements, the MACD Histogram has the potential to identify shifts in momentum before they are reflected in the price action. This early warning system can be valuable for traders looking to enter or exit positions at optimal times, maximizing profits and minimizing losses.
It is important to note that while the MACD Histogram can be a useful tool for anticipating trend changes, it is not infallible. Like any technical indicator, the MACD Histogram is not foolproof and should be used in conjunction with other forms of analysis to make well-informed trading decisions. Traders should also be aware of the limitations of the MACD Histogram, such as its tendency to produce false signals during ranging or choppy market conditions.
In conclusion, the MACD Histogram can hold the secret to anticipating trend changes in the financial markets. By understanding how to interpret the MACD Histogram and incorporating it into a comprehensive trading strategy, traders can potentially gain an edge in identifying profitable trading opportunities. As with any technical indicator, it is essential to use the MACD Histogram in combination with other tools and to exercise caution and discipline in order to achieve consistent success in trading.
